
Supplier Risk Visualizer
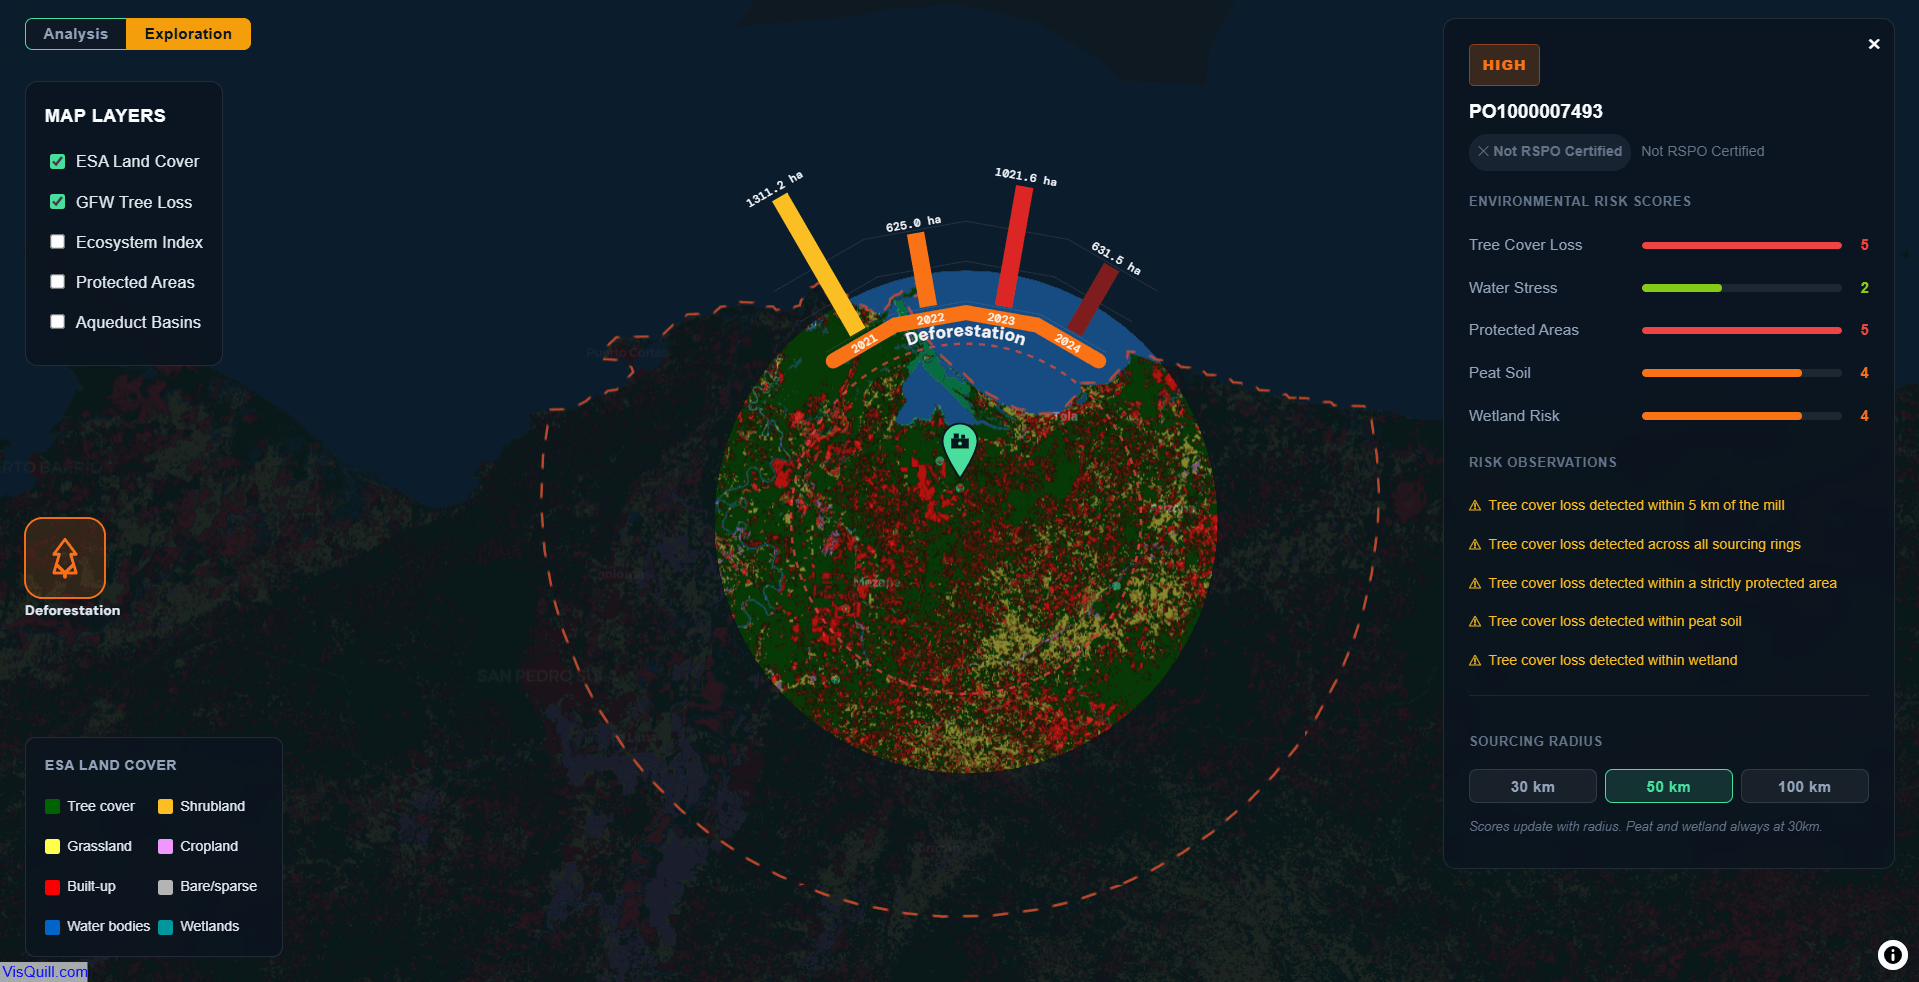
An interactive environmental risk screening tool for palm oil mill suppliers, evaluating deforestation pressure, water stress, protected area overlap, peat soil, and wetland exposure across configurable sourcing radii.
Mockup / Portfolio Project — This tool uses sample data for demonstration purposes only. Risk scores, rankings, and tier classifications are illustrative. Every company applies its own methodologies, thresholds, and business priorities when assessing supplier risk — the values shown here should not be used as a basis for real procurement decisions.
Project Overview
The Supplier Risk Visualizer is an interactive environmental risk screening tool for palm oil mill suppliers. Each mill is evaluated across five environmental dimensions within a configurable sourcing radius, producing a composite risk score that can be used to prioritise supplier engagement and due diligence effort.
Risk Dimensions
Each mill is scored across five environmental layers, all evaluated within a user-selected sourcing buffer (30 / 50 / 100 km):
| Dimension | Data Source | What it measures |
|---|---|---|
| Tree Cover Loss | Global Forest Watch | Annual deforestation within sourcing buffer (2021–2024) |
| Water Stress | WRI Aqueduct | Basin-level water scarcity indicators |
| Protected Areas | WDPA | Overlap extent and IUCN category sensitivity |
| Peat Soil | IMCG Global Peatland Database | Peatland presence and proximity |
| Wetland | Global Wetlands Map | Wetland extent and loss within buffer |
Features
- Regional risk matrix — ranked overview of all suppliers by aggregate environmental score, with tier classification
- Mill detail view — zoom into any facility and explore live spatial data layers at the mill level
- VisQuill spatial lenses — analysis lens locked to the selected mill showing risk scores by sourcing radius; exploration lens for querying deforestation trends at any map location
- Sourcing radius selector — 30 / 50 / 100 km buffer options around each mill
- Ecosystem hex index — H3 hexagon layer showing forest, wetland, and peatland extent across the region
- Data layers: ESA WorldCover land cover, GFW tree cover loss, Aqueduct water risk, WDPA protected areas
Setup
git clone https://github.com/julio-collazos/mill-risk-vis.git
cd supplier-risk
npm install
npm run dev
The dev server proxies external tile services (ESA Terrascope, Global Forest Watch) to avoid CORS issues.
Tech Stack
- React 19 + TypeScript — component architecture and type safety
- MapLibre GL / react-map-gl — interactive WebGL map rendering
- VisQuill GDK + Blueprints — spatial lens SDK for the risk analysis overlays
- H3-js — hexagonal spatial indexing for the ecosystem grid
- Turf.js — geometric operations (buffer generation, overlap calculations)
- PMTiles — local vector tiles for offline-capable rendering
Share this project
Find this project interesting? Share it with your network.